TL;DR
NFT prices have fallen more than those of both native tokens as well as many DeFi projects. The key driver is the concentration of value in a small number of collections, exacerbated by the native token (that NFTs are denominated against) losing value.
The transition to new NFT use cases could come sooner rather than later. Losses incurred by investors on collectibles have been larger and more consistent. Attention may be shifting towards segments like utilities that benefit from new features on emerging marketplaces.
Ethereum has lost notable market share to Solana and other blockchains in the last few months; increasing Solana’s share to highs of~43% in September. One reason is the scalability and low fees of other blockchains. Another is that Ethereum’s role in the NFT space may be gravitating towards more of a store-of-value.
Competition between marketplaces is heating up. X2Y2 on Ethereum and Hadeswap on Solana are taking notable market share from leaders OpenSea and Magic Eden respectively. Emerging marketplaces battle on the basis of new pricing models, optional royalties, and lower fees.
Introduction: Global NFT Activity
The market for non-fungible tokens (NFTs) has had a rough few months alongside this year’s wider drop in asset prices. A distressed macro environment has significantly reduced on-chain activity across the crypto ecosystem, bringing down prices across the board from their 2020-21 highs as investors move down the risk curve and unwind positions. In this report, we distill various metrics to help you understand the industry and decipher various trends through quantifiable data and insightful observation. Weekly trade volume across arts, collectibles and gaming has been trending sideways for the second half of the year which is consistent with the price action of ETH. However, when looking at weekly sales count there is a clear deviation where gaming has trended upwards while Arts & Collectibles continued to decline since August 21, 2022.

Trade Volume
This suggests that transition to new use cases could come sooner rather than later for NFTs. Data on sales count by category shows that arts and collectibles have been gradually losing its share of sales, falling by 42% in October since July. One explanation is that demand for collectibles is much more concentrated than for gaming; 93% of volume stemmed from NBA TopShots, whereas Sorare leads gaming at 71%. Another is that collectibles have proven far more unprofitable than other segments. Data from NonFungible shows that losses incurred by investors on collectibles have been larger and more consistent over the past few months. Investors may therefore be scoping out other NFT segments for profitable trades, such as utilities, in which features such as customized price sensitivity and specialized marketplaces could play a key role.


Price Observation
While NFTs have seen tremendous growth in the last two years, prices have fallen more than those of both native tokens as well as many DeFi projects. The reason is that the value of NFTs (a function of demand) is highly concentrated in a very small number of collections that have seen their prices (denominated in the native token) surge during the boom. But demand for buying virtual goods has started to fall in recent months as users exit the Web 3.0 economy. This has had a downward effect on NFT prices (floor price) that is exacerbated by native tokens losing value relative to US$.

Active Market Wallets
The exit from Web 3.0 and decline of users interacting with NFTs is displayed by the number of active wallet addresses. This number declined from a peak of 31k in July to roughly 12k in October. As a consequence, NFT trade volumes have declined on a weekly basis reaching $45M in the last week of October; down 17% from the beginning of the second half of the year of $54.5bn. The disparity is a consequence of high value NFTs being concentrated in a small number of wallets. Chainalysis estimated that roughly 9% of wallets held 80% of total NFT value at the start of the year. It is also worth noting that active wallets have been relatively stable in the last two months, while trading activity has continued to decline. This may indicate that we have reached a bottom in wallet activity, where remaining users are interacting with Web 3.0 but increasingly holding on to their virtual goods for the time being.

NFT Trade Volume by Chain
Despite a decline in overall trading activity, not all chains have been affected to the same degree. Ethereum has lost notable market share to Solana and other blockchains in the last few months; increasing Solana’s share to highs of~43% in September. One reason is the scalability and low fees of other blockchains, which makes it more attractive for active traders and minting new collections. Ethereum, on the other hand, is still host to some of the highest-value NFT collections e.g. BAYC and whose role in the NFT space is speculated by some to gravitate towards more of a store-of-value. A counter to this argument is that Ethereum is progressing on its roadmap, which promises to alleviate some of the high fees and congestion that it suffered from before the Merge. The battle between chains was recently displayed when Yuga Labs, the team behind BAYC, laid out plans to leave Ethereum as well but the DAO voted against the move.

NFT Marketplace Share
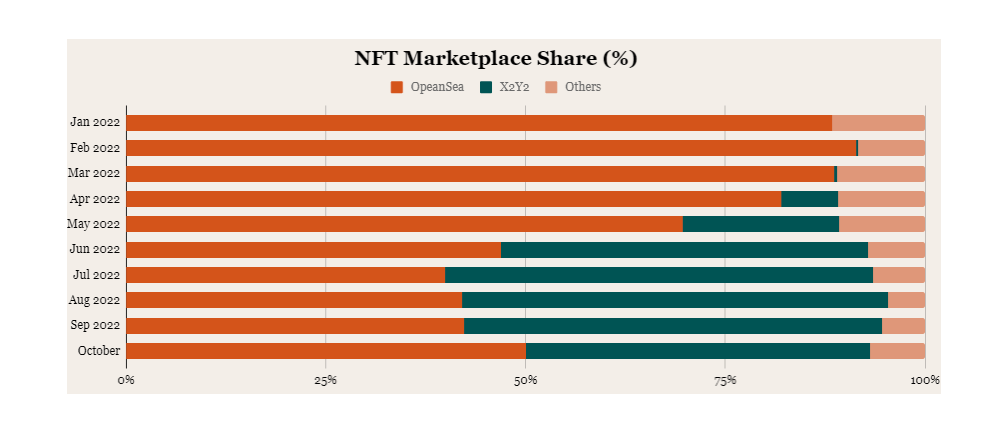
There have also been a few notable developments in marketplaces. On Ethereum, the leading NFT marketplace OpenSea held 90% market share in the first half of 2022 before losing significant share to new players. The growth of X2Y2 in particular has been remarkable, reaching $1.3bn in the last 3 months and having similar share of the NFT marketplace as OpenSea.


X2Y2’s popularity surged after its so-called “vampire attack” in February, whereby the marketplace airdropped its token to OpenSea users and offered high staking yields on the pre-condition that they list their NFTs on the platform. While the token price tanked in the following months, many users stuck with the marketplace for its optional royalties and low trading fees; 0.5% vs. OpenSea’s 2.5%.
This ties into the notion of OpenSea facing increased competitive pressure from specialized marketplaces, who are beginning to unbundle its services. The platform’s initial success lay in standardizing the trading of all NFT segments (where PFPs and collectibles dominate), but this is being challenged as new use cases and token standards emerge.On Solana, marketplace volumes continue to be dominated by Magic Eden, accounting for 85% volumes in the last 30 days. The platform raised $130m at a $1.6bn valuation back in June, when its share of Solana-based NFT transaction volume was estimated at 92%. Despite being the clear leader, Magic Eden has started to lose share as the battle for the second-largest marketplace intensifies. Hadeswap in particular has established itself as the second largest marketplace in the past 3 weeks.

Hadeswap is a fork of the Ethereum-based Sudoswap that uses bonding price curves instead of the open auction pricing model used by most leading marketplaces. The design mimics that of an AMM, where users act as liquidity providers for an NFT and prices are set by a mathematical formula rather than the bid/ask model. For developers, this allows more flexibility on designing price sensitivity of assets which may be particularly useful as NFTs grow their use cases in gaming, utilities, and metaverse projects.
Data also indicates that the mechanism disincentivizes wash trading, whereby traders mimic activity by buying/selling a collection between themselves to spread misinformation about the popularity of an NFT. Wash trading has become cheaper as marketplaces move towards optional royalties and lower platform fees. But in an AMM model like Hadeswap, traders also incur LP fees which may render wash trading a lot more expensive. As shown below, wash trades represent a significantly larger portion of overall trades on Magic Eden than on Hadeswap.


Unique Buyer & Seller Activity
Another indicator of NFT market activity is the unique number of buyers and sellers. While the number of participants on both sides of the trade have been decreasing, recent months have been flat. In 1Q22 there was clearer support for NFT prices as shown by the positive gap between buyers and sellers. Tough macro conditions in the second half of the year led to more users selling NFTs and this gap closing, putting increased pressure on prices as a result. The last few weeks have seen a small but consistent increase in the number of buyers over sellers with overall activity remaining mostly stable since August.

Primary & Secondary Market Activity
Finally, we note that the volume of primary listings has tanked from a peak $370m in May to about $755k in October, with secondary listings similarly declining. The result is that liquidity for NFTs is becoming more fragmented across marketplaces, as creators list infrequently and on fewer exchanges. This disproportionately affects NFT aggregators like Gem and Genie, who provide best execution for users across NFT marketplaces. Demand for their services has stalled as creators choose single platforms to list while secondary activity becomes limited. Gem’s market share has declined from over 20% in June to less than 5% currently.


Conclusion
The NFT market has slowed down considerably over the past months putting an end to the hype that drove virtual goods into the mainstream in 2021. Despite activity plummeting, there are notable signs of some nearterm stability. Meanwhile low fees, new features, and specialized pricing models are opening up the competitive landscape and shifting activity to other chains. While a recovery is unlikely until a rebound in the broader macro environment, the NFT market is evolving quickly as new use cases and token standards emerge.
